What are chart patterns and why are they important?
Chart patterns are an interpretation of a collective view representing how groups of traders may see the markets at a given time, how groups of traders may feel about the price of a specific instrument. If traders are excited about a specific instrument and begin building long positions on it, its price rises, and vice versa, as fear hits the markets, traders begin to sell their holdings, leading to a price decline.
The argument behind chart patterns is that humans' reactions to certain events can sometimes be the same, and their collective reaction can be seen on a chart. Over the years, certain chart patterns have developed, which traders identified and continued to try to take advantage of potential price moves if a pattern target was to successfully materialize.
A chart pattern can form for any reason; it can form as a response to different event types as traders continue to discount market information, in some cases, patterns can form following a rumor or even for unknown reasons that may not be clear at first but may make sense as time passes, sometimes it doesn’t make any sense at all.
The following are just a few examples of how patterns can form
- Trader’s reaction to known information or a news announcement such as a major central bank changing its interest rates or its monetary policy.
- Trader’s anticipation or expectations of unknown information ahead of an upcoming announcement which may lead to a change in market dynamics, such as a change to tax laws, an increase in government spending, or fiscal policy changes that may lead to higher inflation.
- Trader’s reaction to market risks, such as political risks or recession fears.
Do chart patterns work?
Chart patterns are subjective’ in other words, it’s a gray area. Some traders and investors don’t believe in patterns or even technical analysis at all, they believe that price moves are based on other factors and that these patterns are just random.
A trader can be looking at a double bottom formation, while another trader, looking at the same pattern sees a double top formation. In some cases, some traders can see a specific pattern while others don’t see it at all. It can also be that a trader’s bias leads them to only see the patterns that they want to see and find reasons to denyany indication that states otherwise, a human nature maybe!
Chart pattern analysis can be subjective and therefore pattern performance or success rates are difficult to quantify. This is because visually identified patterns can differ depending on what each individual sees. In other words, a trader may see a double top on a chart, while another trader may see the same pattern as a double bottom. Many statisticians have attempted to document their performance with varying results but it can be unreliable.
However, automated chart pattern recognition tools have improved this process. The software uses pre-defined parameters and historical price data to identify patterns, providing a more objective and reliable analysis of their performance.
It is worth remembering that chart pattern analysis should be approached the same way as we do with any technical analysis tool or indicator; in other words, we shouldn't rely on chart patterns by themselves. Chart patterns, if used in conjunction with another type of tool, indicator, or analysis such as volume, momentum, sentiment, or relative strength, to name a few, may provide more insights.
Another point to bear in mind is that different patterns have different entry and exit rules, and traders may approach patterns in different ways. For example, some traders would enter after a pattern is 100% complete with price action breaking and closing beyond a certain threshold, while others may attempt to forecast the pattern as it develops during one of its early stages, thus allowing a potential better risk-to-reward ratio but maybe with a higher failure rate. It is also important not to forget that patterns may fail, and, in some cases, a failed pattern can be an indication of a potential move in the opposite direction.
We have all heard of a “self-fulfilling prophecy”, it also applies to chart patterns. In some cases, as traders see a pattern developing, they begin buying or selling into it as the pattern suggests, which in many cases leads to price action moving in the pattern suggested direction, and as more and more traders get in on the trade, price continues to move as expected. This type of move doesn’t usually last, as it may neither be supported by any new market information nor have any fundamental data behind it. Utilizing other tools and indicators of a different nature can be used alongside it for further validation.
What are the most common chart patterns?
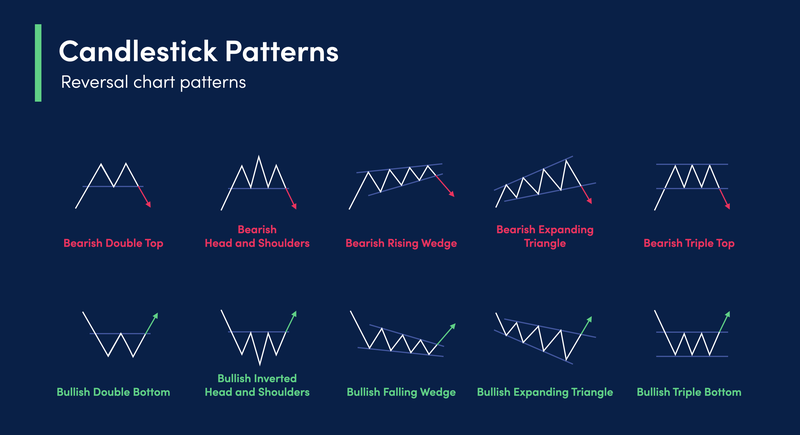
Chart patterns are mainly divided into two categories: Continuation and Reversal Patterns. The following are examples of the most common chart patterns, however, as traders and chartists continue to look through market behavior, more patterns evolve.
- Continuation patterns: Flags and Pennants, Rectangles, Symmetrical, Ascending and Descending Triangles
- Reversal Patterns: Head and Shoulders, Inverted Head and Shoulders, Double Tops, Double Bottoms, Triple Tops and Triple Bottoms.
How to identify chart patterns?
There are multiple ways to identify or recognize patterns on a chart; the methods vary between visualization and automated chart pattern recognition software.
Visualization
Visualizing and identifying chart patterns on any chart type can be challenging, especially at first, patterns can be of a complex nature, and not necessarily obvious to the naked eye. Identifying chart patterns is a skill that improves over time, as traders gain experience in how to trade around these patterns.
Chart pattern analysis can be applied to any chart type, including but not limited to candlestick, point-and-figure, bar charts, or even charts built on fundamental data. The fractal nature of technical analysis means that chart patterns can also be found in different time frames. Chart patterns can form on time frames as low as a one-minute chart, all the way to patterns that may take years to develop.
A trader should also consider that different chart timeframes may have opposite or conflicting patterns. For example, there could be a pattern on a longer timeframe suggesting that a price may go higher; however, on shorter timeframes, there is an opposite pattern. Some experienced chart pattern traders implement strategies that attempt to take advantage of the discrepancies between patterns, for example, opposite patterns on different timeframes or in some cases, corresponding patterns on correlated currency pairs or financial instruments.
Visualizing chart patterns requires a trader to customize their charts in a way that works for them; in other words, whatever chart settings improve a trader’s pattern identification ability, those are the settings they want to keep. This can differ between individuals and can vary based on different factors. An example would be a chart color setting, including up and down candles, chart background color or grids, and the overall charting software color scheme. Some chartists may prefer white and black for up and down candles, while others may opt for green and red. Sometimes the default settings on a charting software may suit one trader but may not suit another, and therefore we should be testing which ones work best for us.
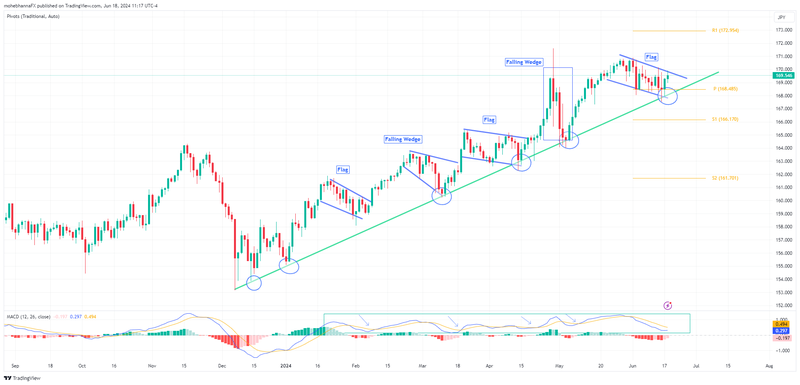
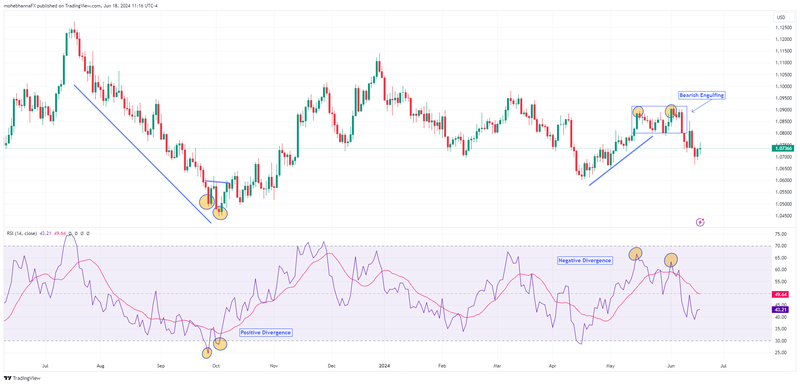
On the charts below, we highlighted some patterns which have developed over time. We have also highlighted other indicators, which may have offered more clarity about the outcome of the pattern in discussion.
It goes without saying that some patterns have a high failure rate; technical analysis is an art that helps with probabilities rather than a forecast. Also, the patterns/indicators used on the charts below are just examples for clarification only, traders may consider applying their preferred tools or indicators alongside any technical analysis approach.
The above chart outlines examples of Continuation Patterns within an uptrend. Price action is moving within an uptrend, during which multiple corrections took place forming a mix of flags and falling wedge patterns. Combining indicators such as Standard pivot points or Moving Average Convergence Divergence (MACD) can help with identifying critical levels, for example, the MACD indicator remained within its positive zone (above zero line) during the entire uptrend, and the MACD line (Blue) crossed above (Blue Arrows) the Signal line (Gold) on every occasion as price found support along the trend line. (Blue circles)
The above chart outlines examples of Reversal Patterns, on the left side we have a downtrend marked by a blue line, and a double bottom formation marked by gold circles reflecting a potential for reversal, which was also supported by a positive divergence on the Relative Strength Index (RSI) indicator as marked on the chart.
On the right side of the chart, the price was trading in an uptrend which was interrupted by two opposite patterns: a rectangle formation suggesting a potential for continuation as well as a double top suggesting a potential reversal. However, the reversal was also supported by a Bearish Engulfing Candle as well as a negative divergence on RSI.
Autochartist
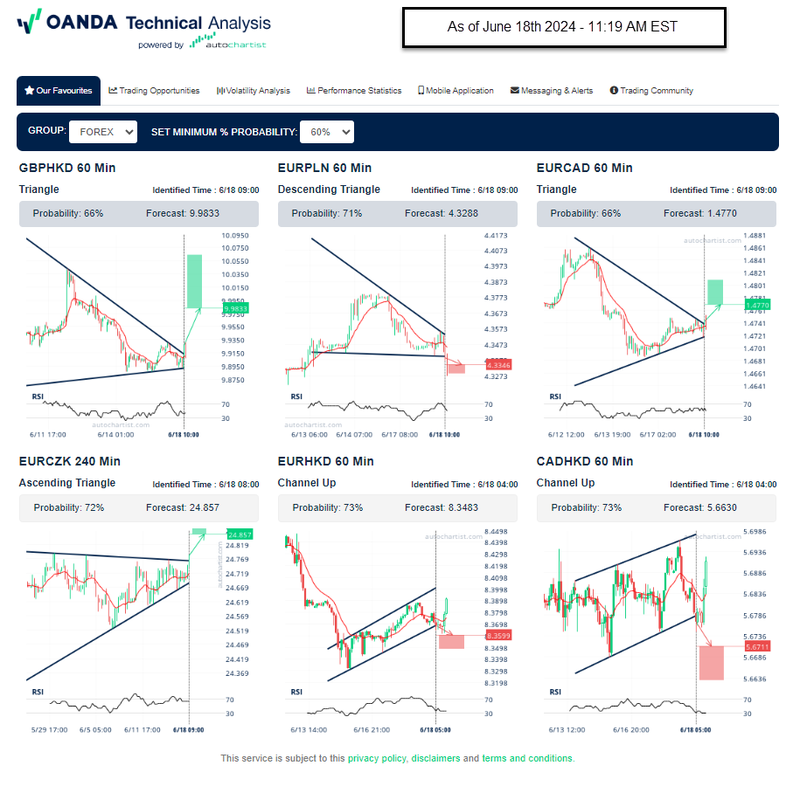
Autochartist is one of the available advanced chart pattern recognition software. It was one of the first ones to enable this technology and make it available to traders around the world. The software has many features which allow traders to customize their autochartist interface according to their individual needs and strategies.
A trader can customize it based on specific instruments, timeframes, pattern type, or even pattern stage as it develops. The versatility allows traders to compare patterns on correlated pairs or correlated time frames which may be incorporated into a trader’s strategies. For example, for a trader looking at a bearish pattern on EUR/USD, it may be worthwhile to review correlated pairs such as GBP/USD or AUD/USD.
Autochartist interface has other features which may be of interest, for example, patterns can be reviewed or selected based on their success/failure rates, as well as the option to review patterns performance statistics.
If a trader prefers so, Autochartist offers an MT4 plugin that enables traders to automate the Autochartist patterns trading. Traders can install the plugin to their MT4 platform, review and customize it to their preferred settings, and once correctly enabled, trades can be automatically executed on the trader’s forex trading account. Autochartist also offers a mobile app that notifies users about trading setups.
TradingView
TradingView is a leading charting software, a one-stop shop used by millions of traders around the world. This versatile and all-inclusive charting software offers traders a vast variety of in-house built indicators and trading tools. Traders and third-party providers can also create their own tools, integrate them into TradingView, and make them available to other users.
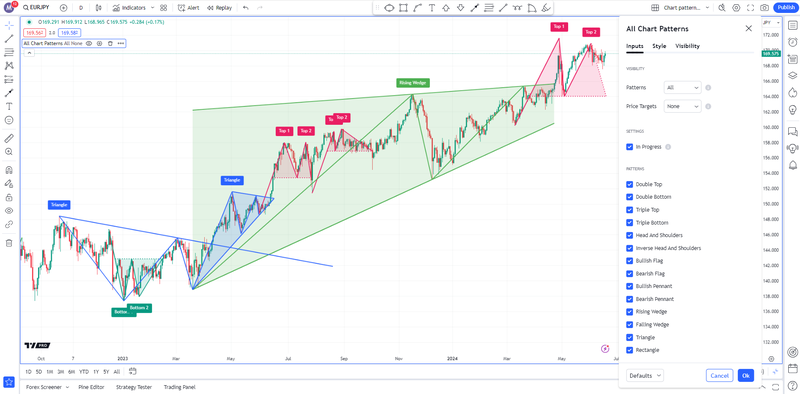
The “All Chart Patterns” indicator enables traders to automatically display different chart patterns on any timeframe of their choice. Traders can also enable the “All Patterns” and the “Target” options to review how these patterns performed in the past.
The ability to integrate chart patterns recognition into TradingView offers traders an edge because they can add other types of their preferred indicators to validate the potential for a chart pattern.
The above chart image includes multiple chart patterns automatically plotted by the recognition tool; it also shows the settings available to users so they can customize according to their own preferences.
Disclaimer
This article is for general information purposes only, not to be considered a recommendation or financial advice. Past performance is not indicative of future results.
Opinions are the author's; not necessarily that of OANDA Corporation or any of its affiliates, subsidiaries, officers or directors.
Leveraged trading in foreign currency contracts or other off-exchange products on margin carries a high level of risk and is not suitable for everyone. We advise you to carefully consider whether trading is appropriate for you in light of your personal circumstances. You may lose more than you invest. We recommend that you seek independent financial advice and ensure you fully understand the risks involved before trading.


